

AllQuestion and Answers: Page 1001
Question Number 120541 Answers: 1 Comments: 0

Question Number 120534 Answers: 2 Comments: 1

Question Number 120531 Answers: 1 Comments: 1
Question Number 120529 Answers: 1 Comments: 1

Question Number 120528 Answers: 0 Comments: 0
Question Number 120524 Answers: 0 Comments: 0
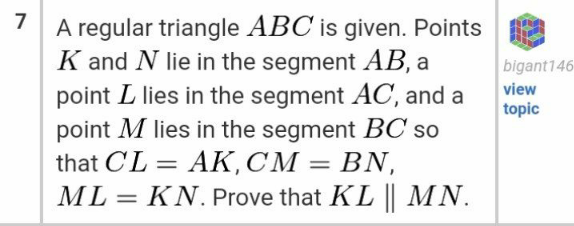
Question Number 120519 Answers: 1 Comments: 1
Question Number 120515 Answers: 1 Comments: 0
Question Number 120511 Answers: 3 Comments: 0
Question Number 120502 Answers: 2 Comments: 0
Question Number 120480 Answers: 4 Comments: 0
Question Number 120477 Answers: 2 Comments: 0

Question Number 120475 Answers: 1 Comments: 0

Question Number 120472 Answers: 0 Comments: 0
Question Number 120471 Answers: 1 Comments: 0
Question Number 120470 Answers: 0 Comments: 0
Question Number 120469 Answers: 1 Comments: 0
Question Number 120468 Answers: 0 Comments: 2
Question Number 120467 Answers: 1 Comments: 0

Question Number 120464 Answers: 1 Comments: 0
Question Number 120463 Answers: 2 Comments: 0
Question Number 120461 Answers: 1 Comments: 0
Question Number 120459 Answers: 0 Comments: 1
Question Number 120455 Answers: 0 Comments: 0

Question Number 120452 Answers: 2 Comments: 0
Question Number 120445 Answers: 1 Comments: 0
Pg 996 Pg 997 Pg 998 Pg 999 Pg 1000 Pg 1001 Pg 1002 Pg 1003 Pg 1004 Pg 1005